Reciprocal Trig Functions
Usually I introduce the reciprocal trig functions early on, but this year I decided to hold off on them, as they seemed to just make everything confusing, especially when we learned about graphing.
So this year, first we learned all sorts of things about sine, cosine, and tangent, including how to graph them and variations on them. Then after a test, I started on secant, cosecant, and cotangent.
We began with a do now that wasn’t about trig at all. I had taken pictures of the stuff on the board, but apparently I don’t properly know how to manage storage on a smart phone, so they’re gone now. Anyway, I’m going to do my best to recreate them.
Here were the instructions on the board when my students came in:
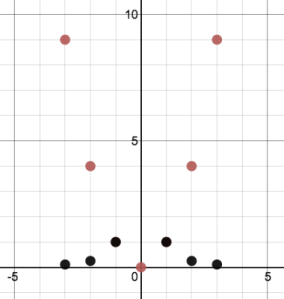
So anyway they did that, and got this graph:
They weren’t sure what was going on with the 1/x^2 graph, so I added some x-vales between -1 and 1, and then they got the idea:
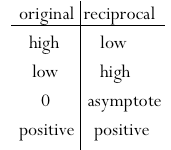
After that I asked them to help me fill in a table comparing the two graphs. They came up with something like this:
All true things. So I gave them a sheet with 6 graphs on it: sine, cosine, tangent, cosecant, secant, and cotangent. Then I asked them to cut them out and match them into pairs — pairs in which each graph was the reciprocal of the other. Obviously they also had to explain how they made their matches.
I also made up an instruction sheet, but I didn’t end up using it, except for with a girl who did the activity the following day.
I thought it was interesting that many of the students’ first instincts told them to just pair up the graphs that looked alike — sine and cosine, tangent and cotangent, secant and cosecant. (I didn’t label the new graphs with their full names — just the shortcuts, sec and csc, so I don’t think that was part of it.) When I reminded them of the table we had created on the board, that seemed to help, and students sorted it out quickly enough.
Afterwards, I graphed the reciprocals together on the board (using desmos of course) so that we could double check that they followed the table’s guidelines that we had come up with earlier.
This is the first time that I’ve gotten the sense that my students understand why the secant and cosecant graphs look the way that they do. I will definitely be doing this again next time.

